Cmndr
A system monitor for everyone.

Overview
Your Mac, at a glance.
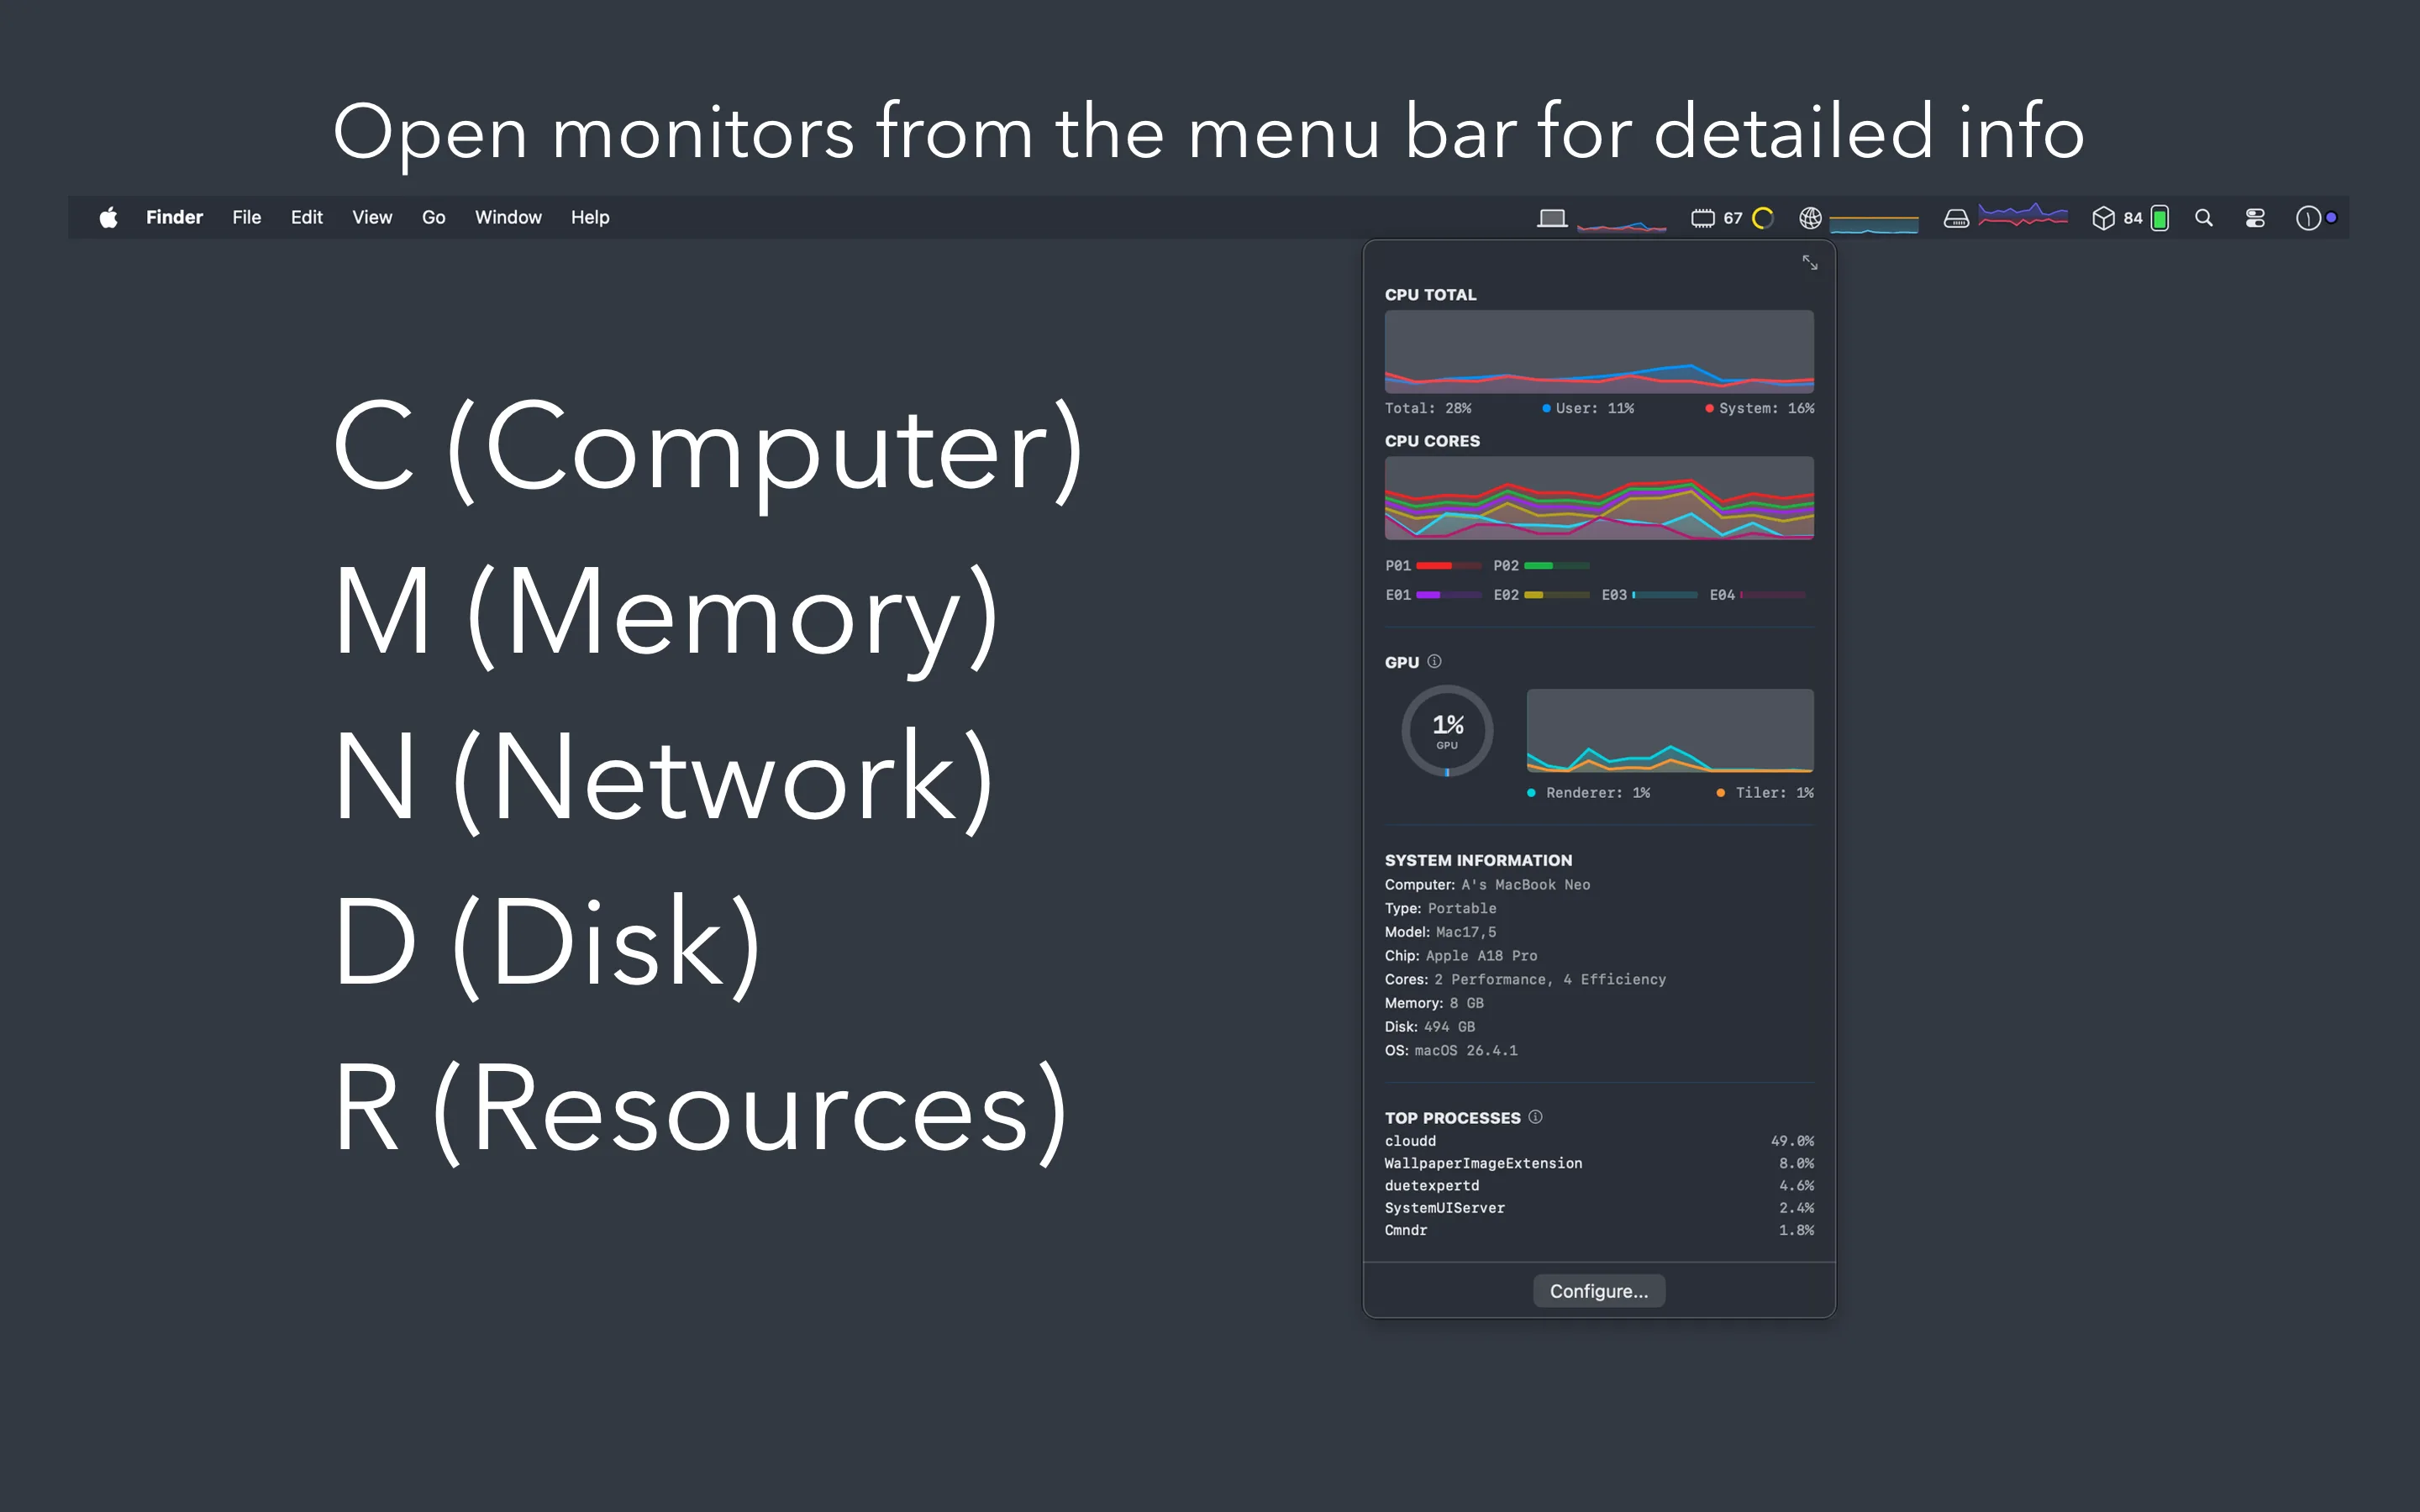
Whether you just want to keep an eye on CPU usage or you need GPU temperatures, per-core breakdowns, and top processes — Cmndr puts it all in your menu bar where you can see it at a glance. Five live graphs sit in your menu bar, and a single click opens a detailed panel with everything you need to know.
What you can monitor
Five letters. Everything that matters.
Computer
Total CPU and GPU usage, per-core breakdown, renderer and tiler utilization, and the top processes eating your CPU.
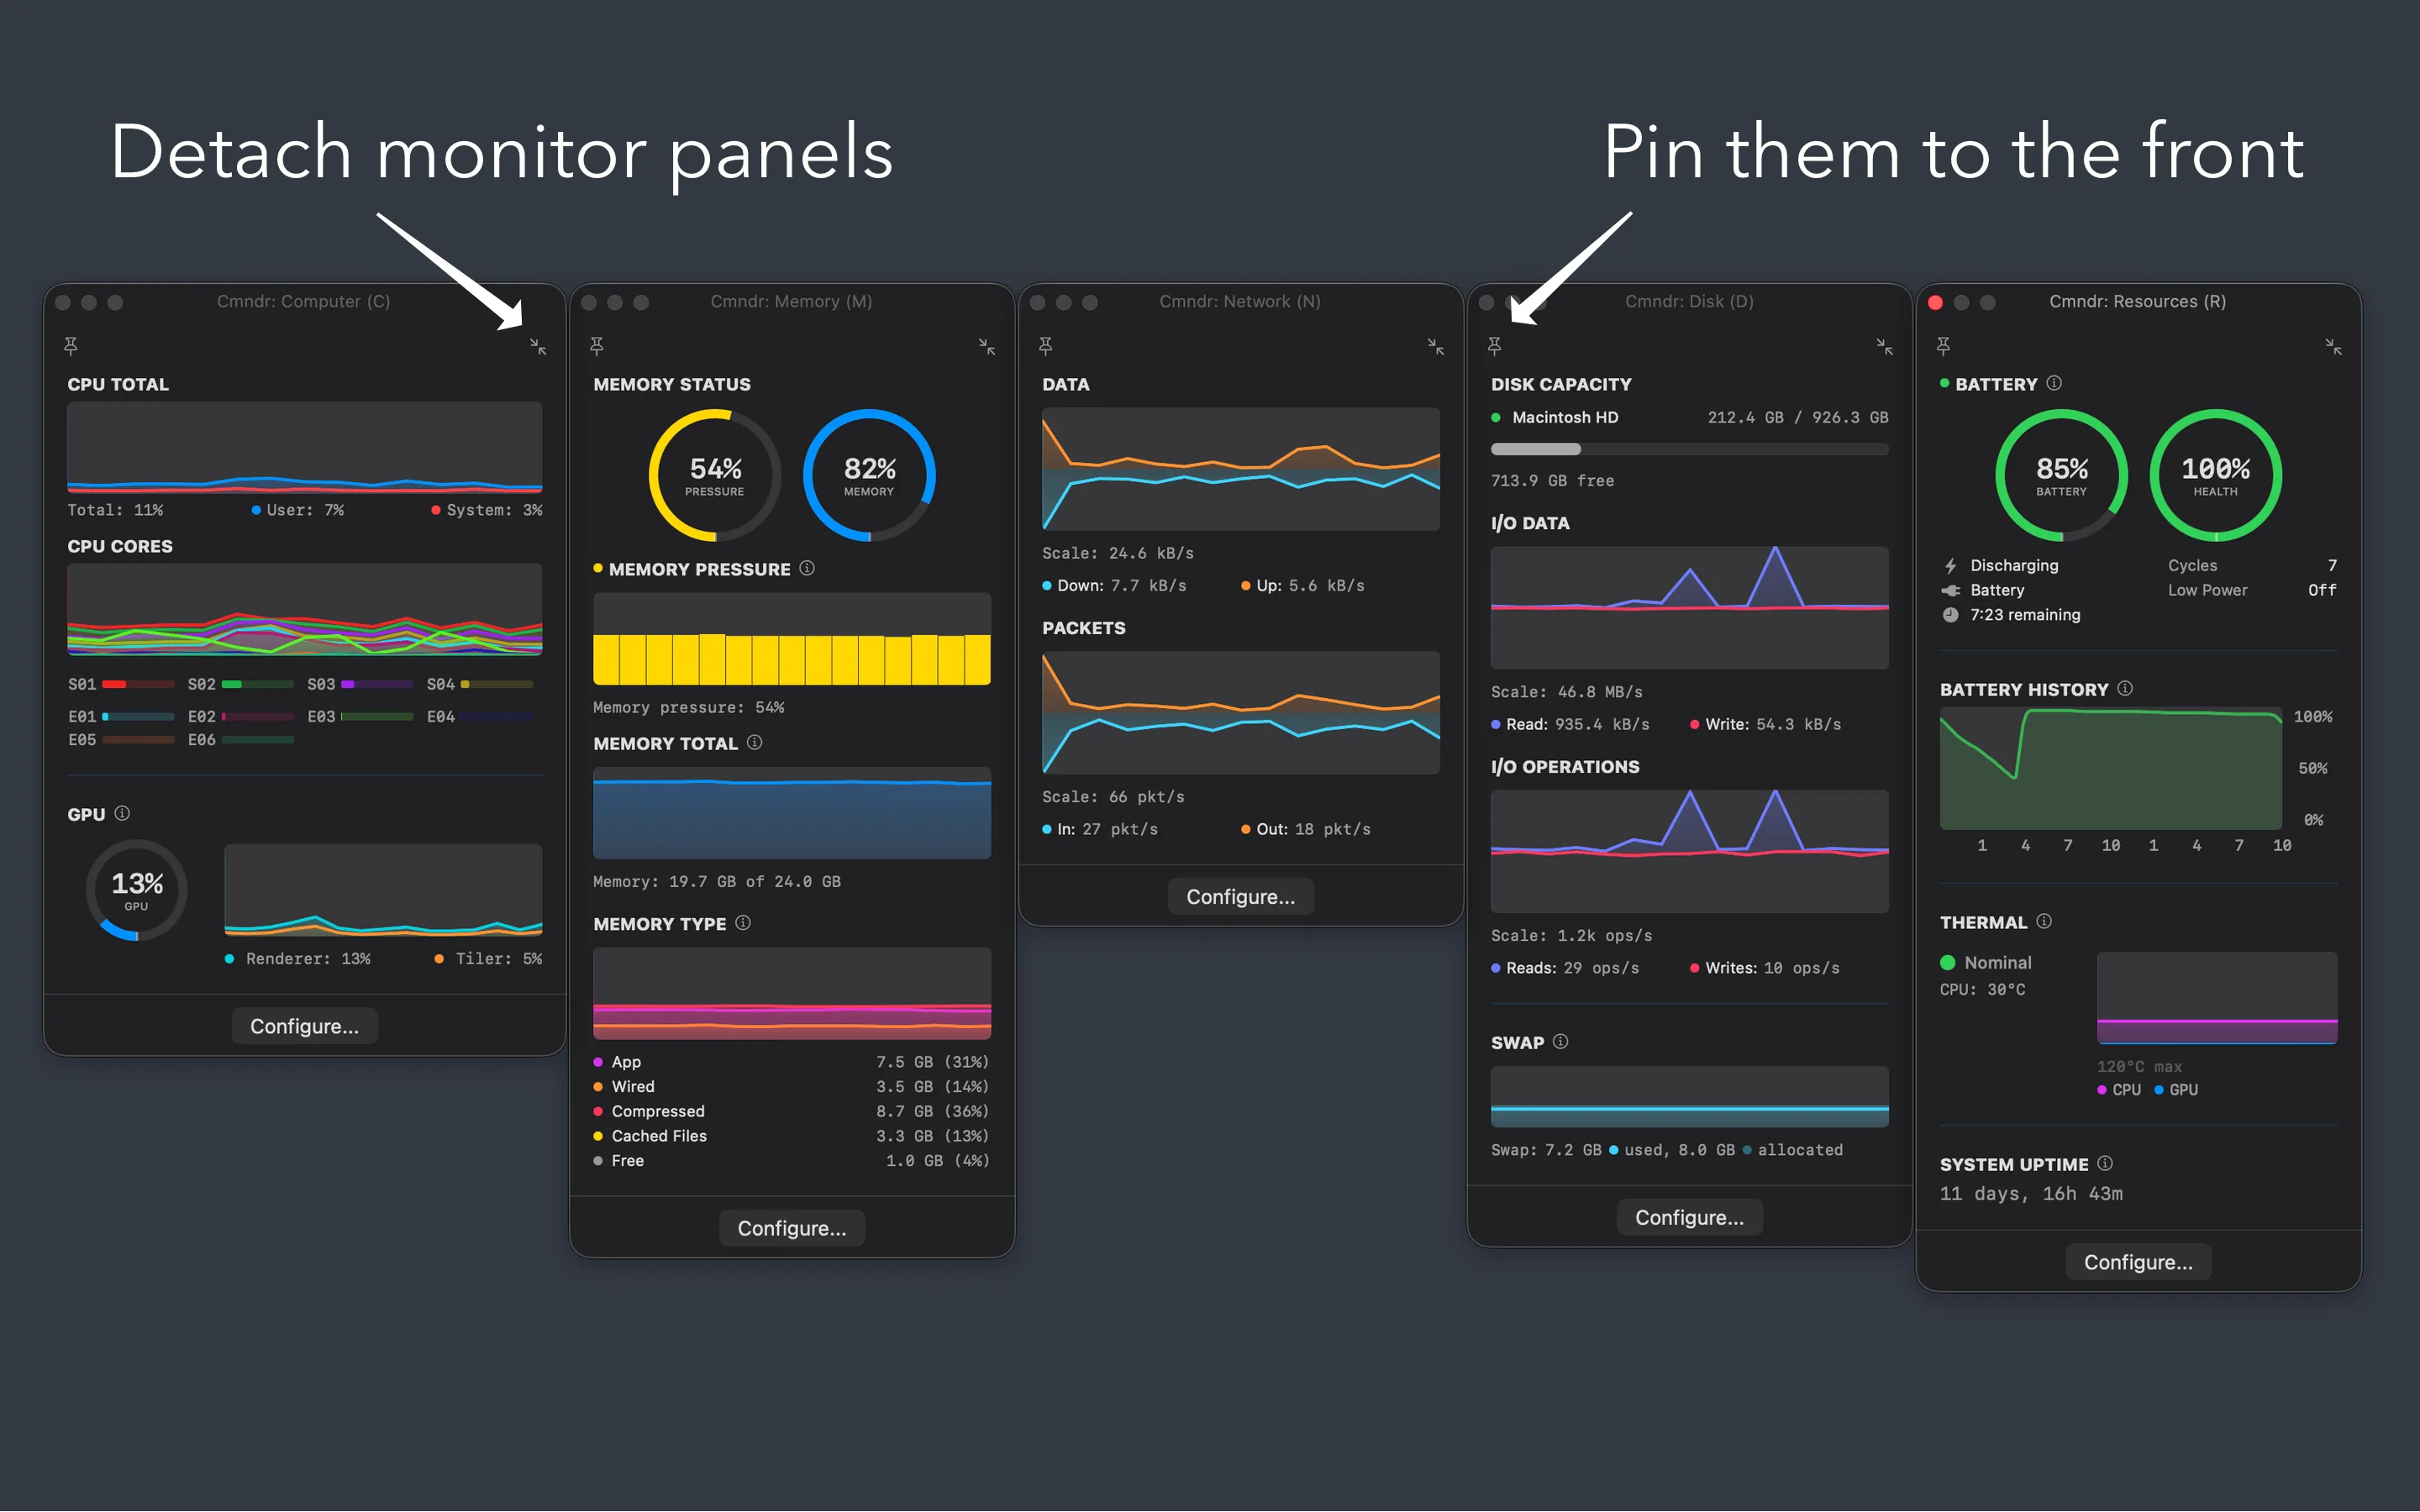
Memory
Pressure level, usage by type — app, wired, compressed, cached — and the processes using the most memory.
Network
Download and upload speeds, packet rates, and your IP addresses. Click to copy.
Disk
Read and write throughput, I/O operations, capacity per volume, and swap usage.
Resources
Battery level and health, 24-hour charge history, power draw in watts, CPU and GPU temperatures, and thermal state.
Philosophy
Out of the way. Never out of reach.
Stays out of your way
- Lives in the menu bar — no dock icon, no desktop clutter
- Click to see details, click away to dismiss
- Detach any panel into a floating window and pin it on top while you work
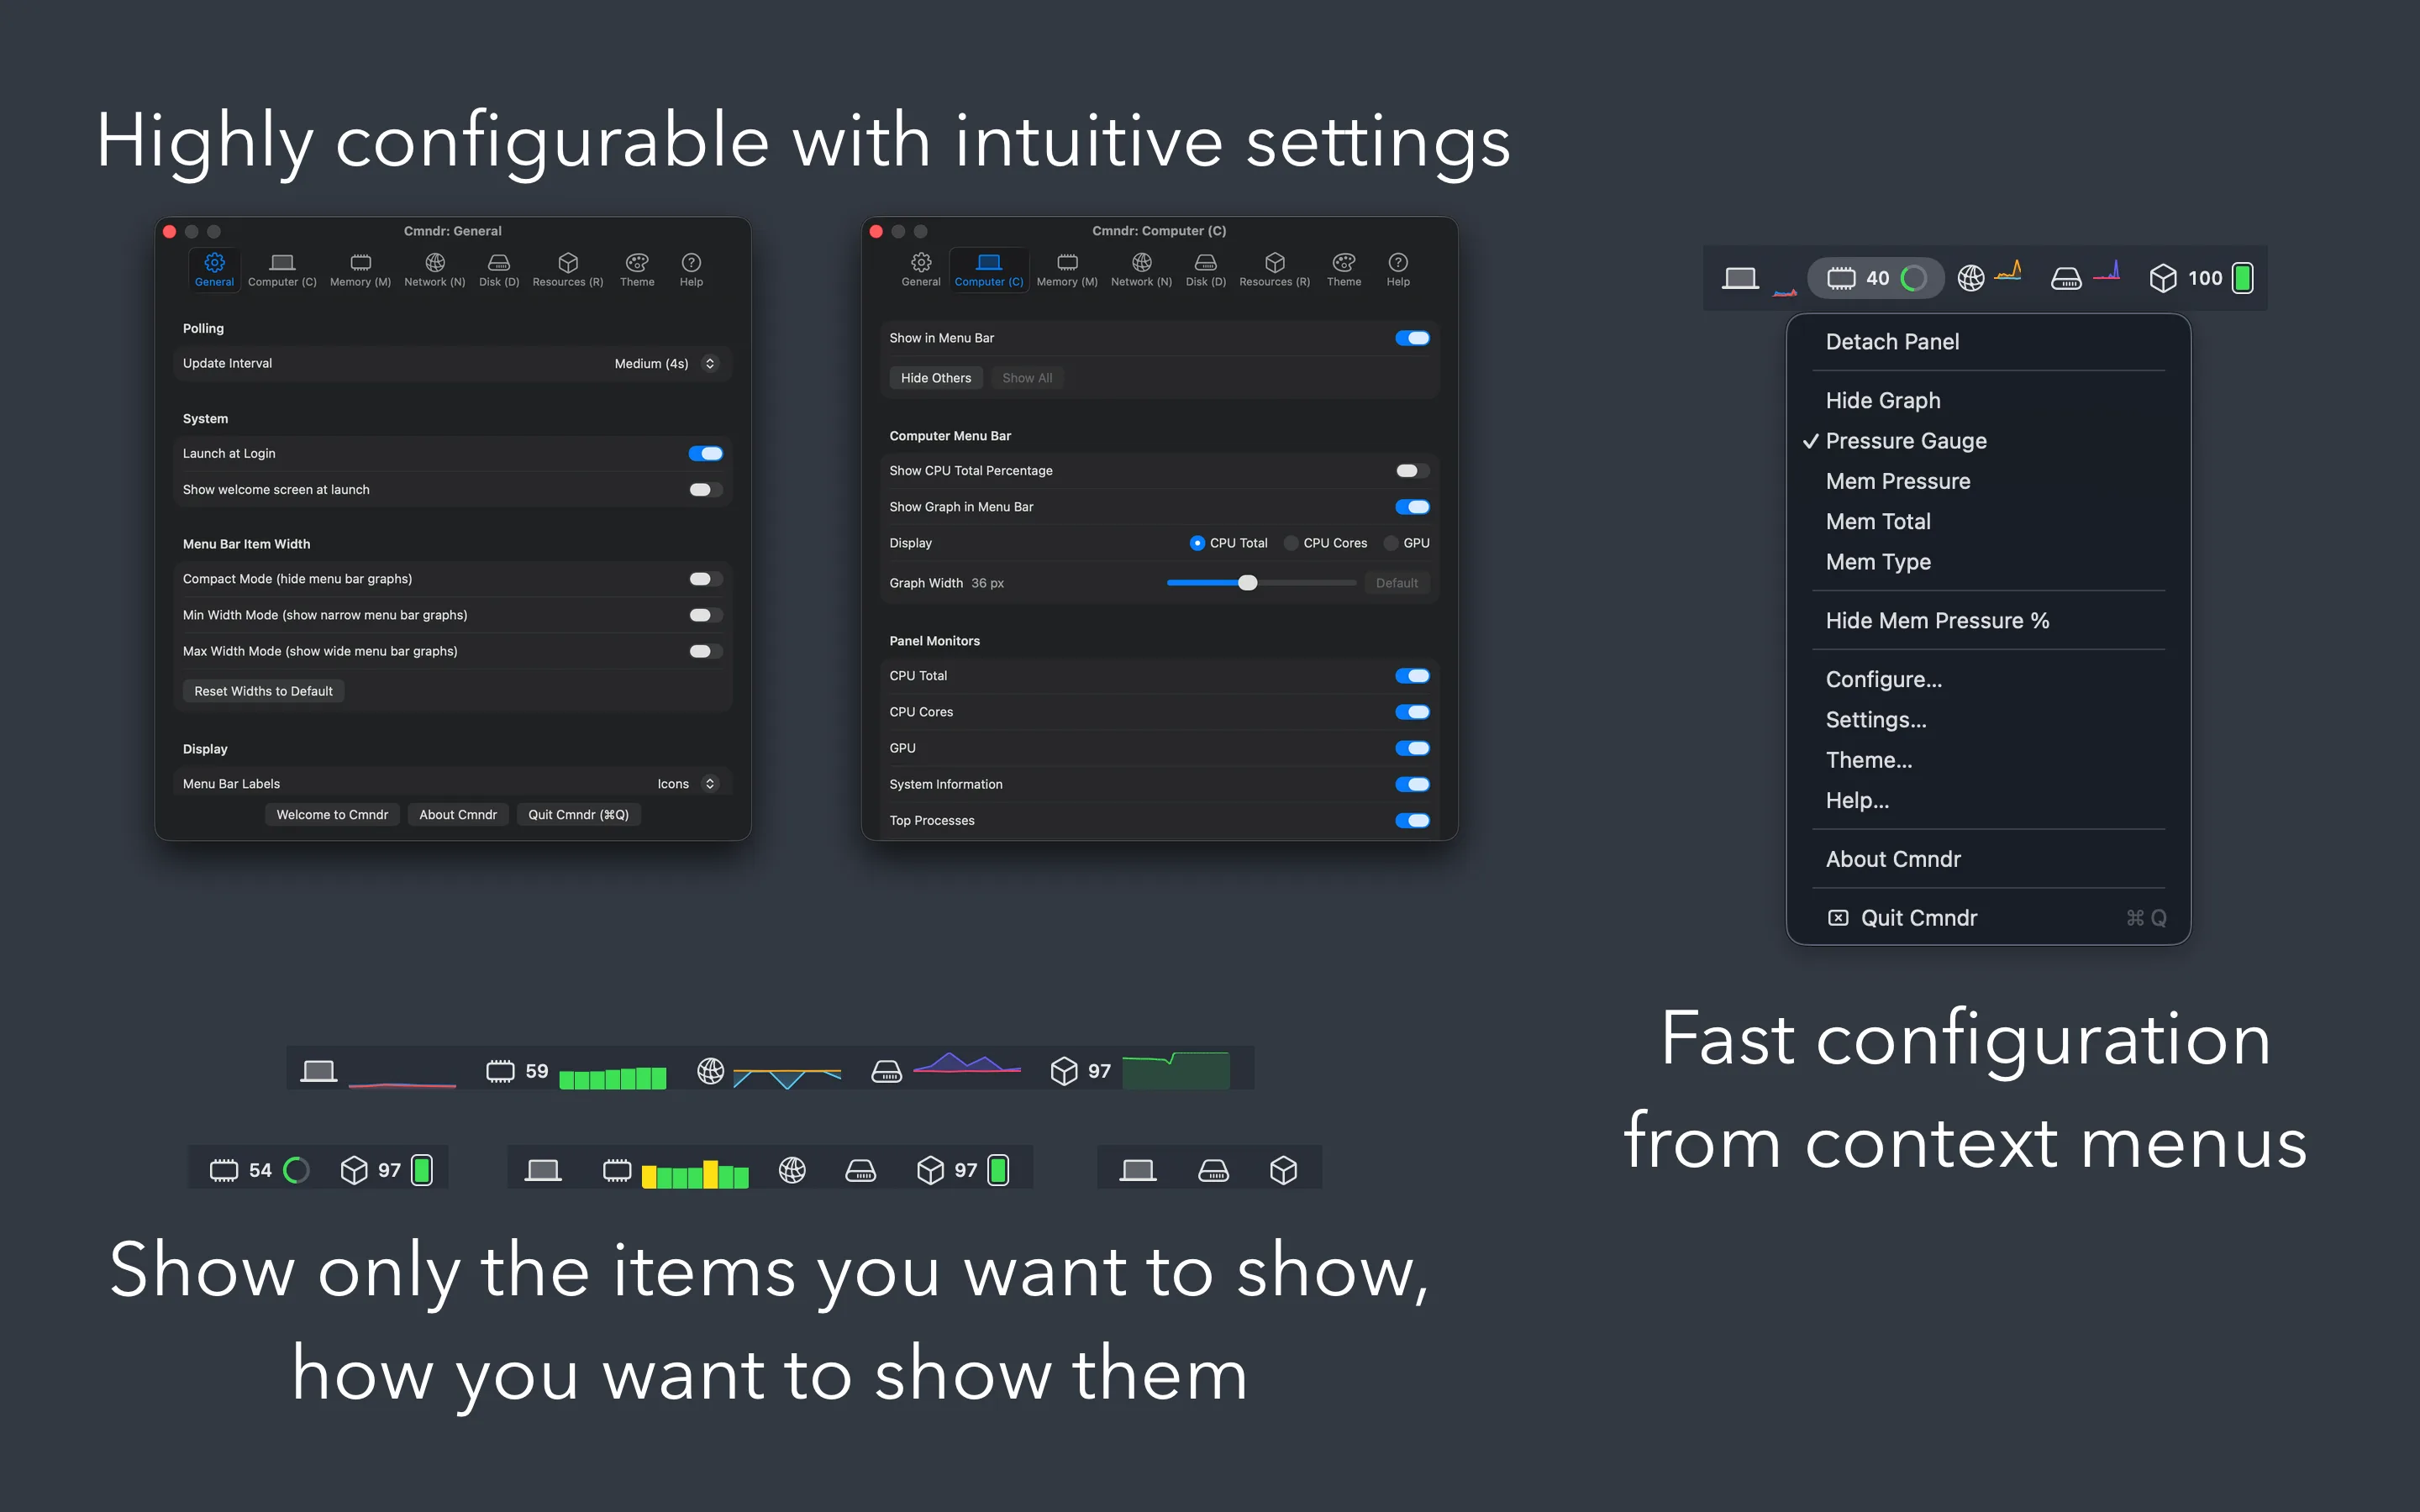
- Right-click any menu bar item to switch display modes or open Settings
- Compact mode for machines with limited menu bar space
Make it yours
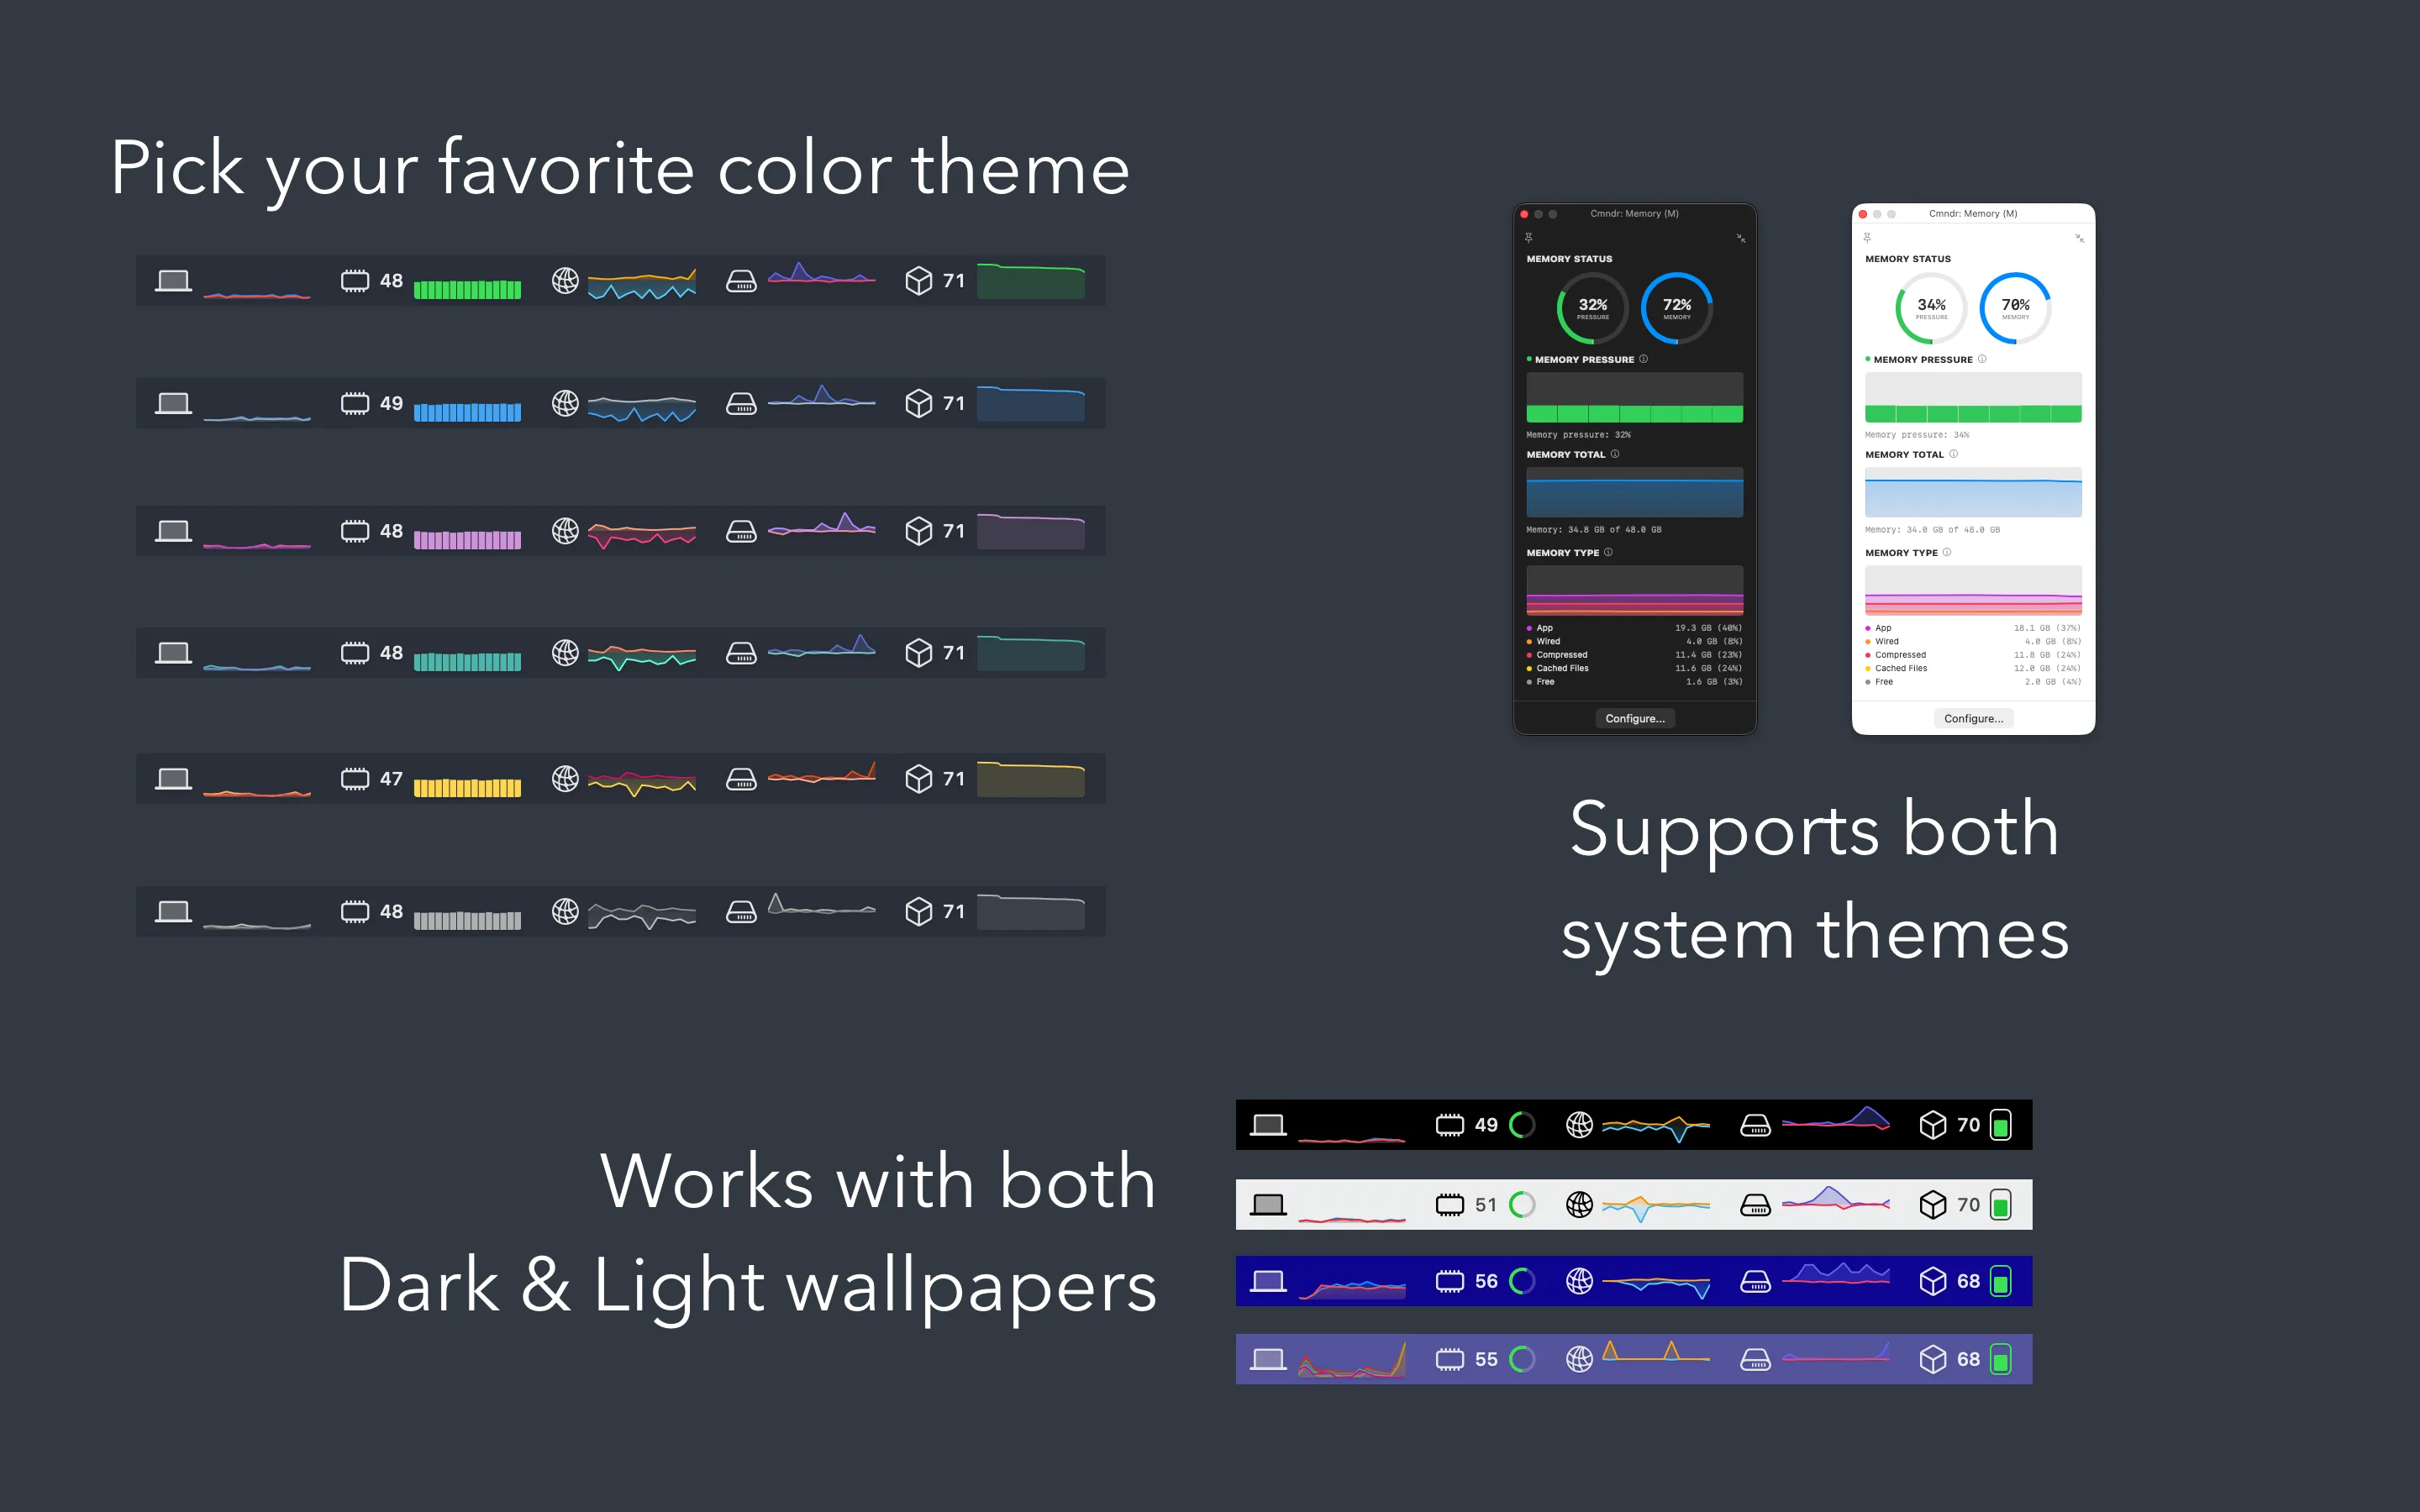
- Seven color themes
- Automatic light and dark mode
- Multiple display modes per monitor — pick the graph that matters most
- Adjust graph widths, toggle sections, set update speed from slow to extreme
- Show or hide inline percentages for CPU, memory pressure, and battery
Native and private
Built for your Mac. Yours alone.
Truly native
- Built with SwiftUI and AppKit — no Electron, no web views, no bloat
- Designed for Apple Silicon Macs (M1 and later)
- Fully sandboxed for your security
Truly private
- Does not transmit or collect your data
- Everything stays on your Mac
- No accounts, no tracking, no analytics
Details